Dashboard cards
Your cards, card configurations, and dashboard layout persist until you change them. The settings remain intact after you sign out and are available on your dashboard when you sign in again.
The following cards are available to add to your dashboard:
-
Service Mode. Displays Service Mode Interrogation failure counts by category, from BOT to EOT (1969–2070).
-
Task Monitor. Displays the status (Failed, Warning, Error, Other, and Success), task count, and task statistics for the current day and six previous days.
-
Validation. Displays the aggregated reads count that have successfully passed validation for the current day (from midnight to the most recent updated time).
Tip: When you add Validation cards to the dashboard, the count for all the service points in the system appear on the card.
Adding dashboard cards
-
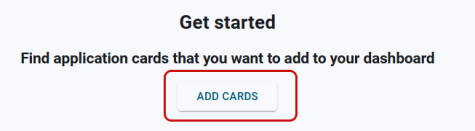
Click Add Cards on the dashboard. This option appears when there are no cards on the dashboard.
Or
Select Actions menu (
 ) in the page header and then select Add.
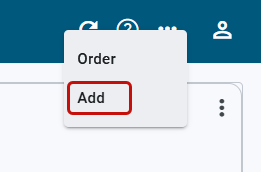
-
In the Add cards dialog that appears, select the wanted card, and then click Add.
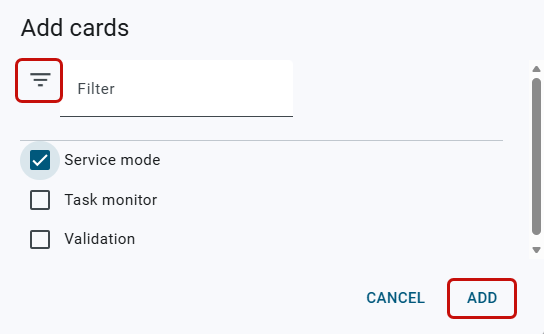
Tip: To quickly locate a card option in a lengthy list of options, click Filter (
 ) on the Add cards dialog, enter all or part of a card name, and then press Enter. The results appear in the list. To clear the results, click X in the filter box.
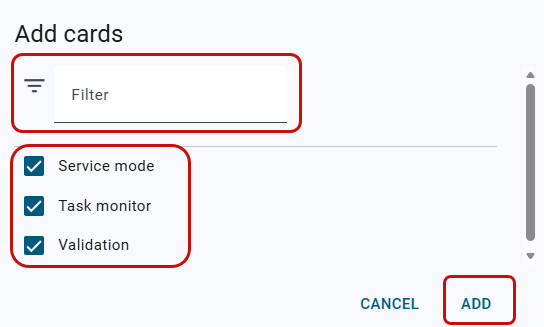
Multiple cards may be added to the dashboard at the same time.
Tip: By default, when adding a Validation card to the dashboard, the card appears in the form of a small-sized card. For more information, see Small validation card.
Managing dashboard cards
-
To configure a card, select Actions menu (
 ) on the card and then select Configure.
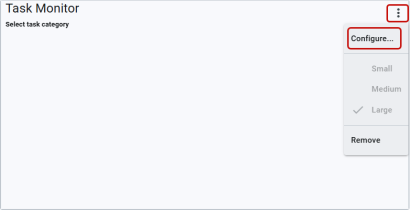

Note: By default, Service Mode cards are automatically configured as large cards and cannot be reconfigured.
In the Configuration dialog that appears, select the applicable task category (Task Monitor cards) or configuration group (Validation cards) from the dropdown menu and click Apply. The selected task category or configuration group appears on the card.
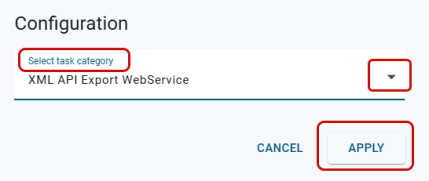
Tip: When configuring Task Monitor cards, the selected category and its data appear on the card. The card contains the applicable task statuses (Failed, Warning, Error, Other, and Success) for a week of data (the current day plus the six previous days). By default, the Success status does not appear on the chart. Clicking the Success legend adds the status to the chart.
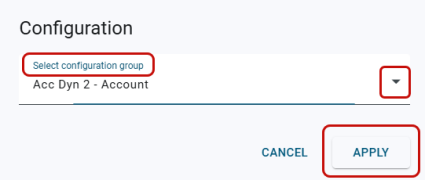
Tip: When a configuration group is selected, the data shown on the card is only for service points in the system for the selected group.
-
To rearrange the cards on the dashboard, select Actions menu (
 ) on the page header and select Order.
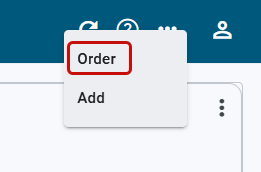
In the Card order dialog that appears, click and drag the order icons (
 ) to indicate the wanted card order, and then select Update.
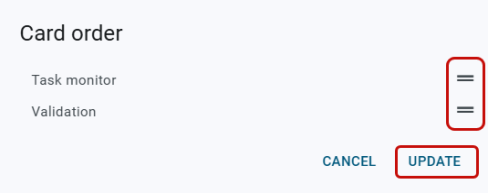
-
To remove a card from the dashboard, select Actions menu (
) on the card and then select Remove.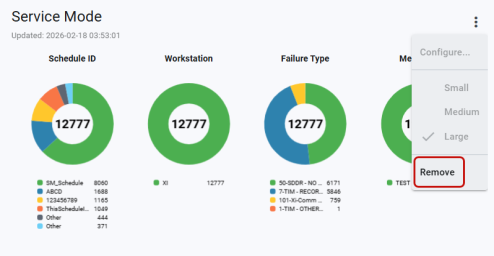
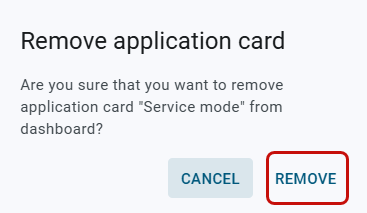
Confirm this action by selecting Remove in the dialog that appears.
-
To resize Validation cards, select Actions menu (
) on the card and then select Small, Medium, or Large. The card resizes automatically. 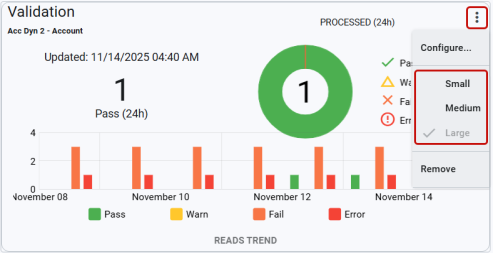
For more information about the data that appears on the card, see Validation cards.
Note: The Service Mode cards and Task Monitor cards appear in the form of large-sized cards and cannot be resized.
Related topics: